keeping track of time
Over the course of my graduate career, I’ve moved away from what you might call a ‘look busy’ approach to getting things done. The ‘look busy’ approach values time invested into something over results and relegates getting things done below ‘look like you’re doing important things.’ These days when I’m done with work I go home, and when I’m at work I make the most of it by being as efficient as possible.
Part of what helps keep me in line is actually recording what I’m doing while I’m at work. But all the existing solutions I found required the user to actively do something when switching between tasks. I used some of these, like Watson and timetrap, but they seem to be written by people whose time isn’t being yanked in a hundred different directions throughout the day. Throughout the day, I have students asking me questions, I go talk to graduate students about projects, I have to get up and stop running an experiment, I remember to attend a seminar, etc. And I of course forget to ‘clock out’ whenever I get pulled away from what I’m working on. The result was a really inaccurate portrait of what I spent my time doing.
I wrote a very small CLI in Go (source code here) that I use to log what I’m doing instead. It’s pretty crude but it works for my purposes: I want a broad understanding of what I’m doing every day that I don’t have to actively think about to use. The application, called time-track, can be called at the command line directly, but I have it running as a cron job every 15 minutes:
*/15 * * * * . /Users/lreding/.bash_profile && open time-track
Whenever it pops up, I tell time-track what I’m up to and go about whatever I’m doing. I never have to remember to open it and it takes a second to record what I’m doing, so the distraction is minimal. To save typing, I have a config file that lists all the available projects I might be working on; I just have to select the number associated with each project. An example:
⚡ time-track
0) email
1) working with students
2) teaching
3) cat gifs

▽ What are you working on?
3
I’ve been using it at work for about a month now, which is longer than I’ve used any other the other applications. It’s far from perfect, but it’s really useful both (a) to be reminded constantly to be working on something productive and (b) to be able to look back in time and see what you were working on, when. The data are saved in a simple csv file that records the Unix time and the project you were working on at that time.
It’s now easy to create visualizations in R using ggplot2:
# load packages
library(tidyverse)
library(magrittr)

# read in the csv file
df <- read_csv("~/.time-track.csv", col_names = c("index", "date", "project"))

# define a long list of colors
cols <- c("#771155", "#AA4488", "#CC99BB", "#114477", "#4477AA", "#77AADD", "#117777", "#44AAAA", "#77CCCC", "#117744", "#44AA77", "#88CCAA", "#777711", "#AAAA44", "#DDDD77", "#774411", "#AA7744", "#DDAA77", "#771122", "#AA4455", "#DD7788")

# format date
df %<>%
  mutate(date_formatted = date %>% as.POSIXct(origin = "1970-01-01",tz = "GMT") %>% format(format="%Y-%m-%d"))

# plot projects across time
df %>%
  mutate(start = date - 900,
         end = date) %>% # figure out when each project was started (recall I have time-track open every 900 seconds)
  mutate(start_formated = start %>% as.POSIXct(origin = "1970-01-01",tz = "GMT") %>% format(format="%Y-%m-%d"),
         end_formated = end %>% as.POSIXct(origin = "1970-01-01",tz = "GMT") %>% format(format="%Y-%m-%d")) %>% # more date formatting
  mutate(day_start = lubridate::date(start_formated),
         day_end = lubridate::date(end_formated)) %>%
  filter(! is.na(project)) %>% # remove NA projects
  group_by(project, day_start) %>%
  tally(sort = T) %>% # find number of times each project was recorded each day
  mutate(hours = n / 4) %>% # get the number of hours for each project / day
  ggplot(aes(x = day_start, y = hours)) +
  geom_col(position = "fill", aes(fill = project))+ # create bar plot
  theme_minimal() +
  scale_fill_manual(values = cols) + # change the colors of the bars
  labs(y = "proportion of time", x = day)
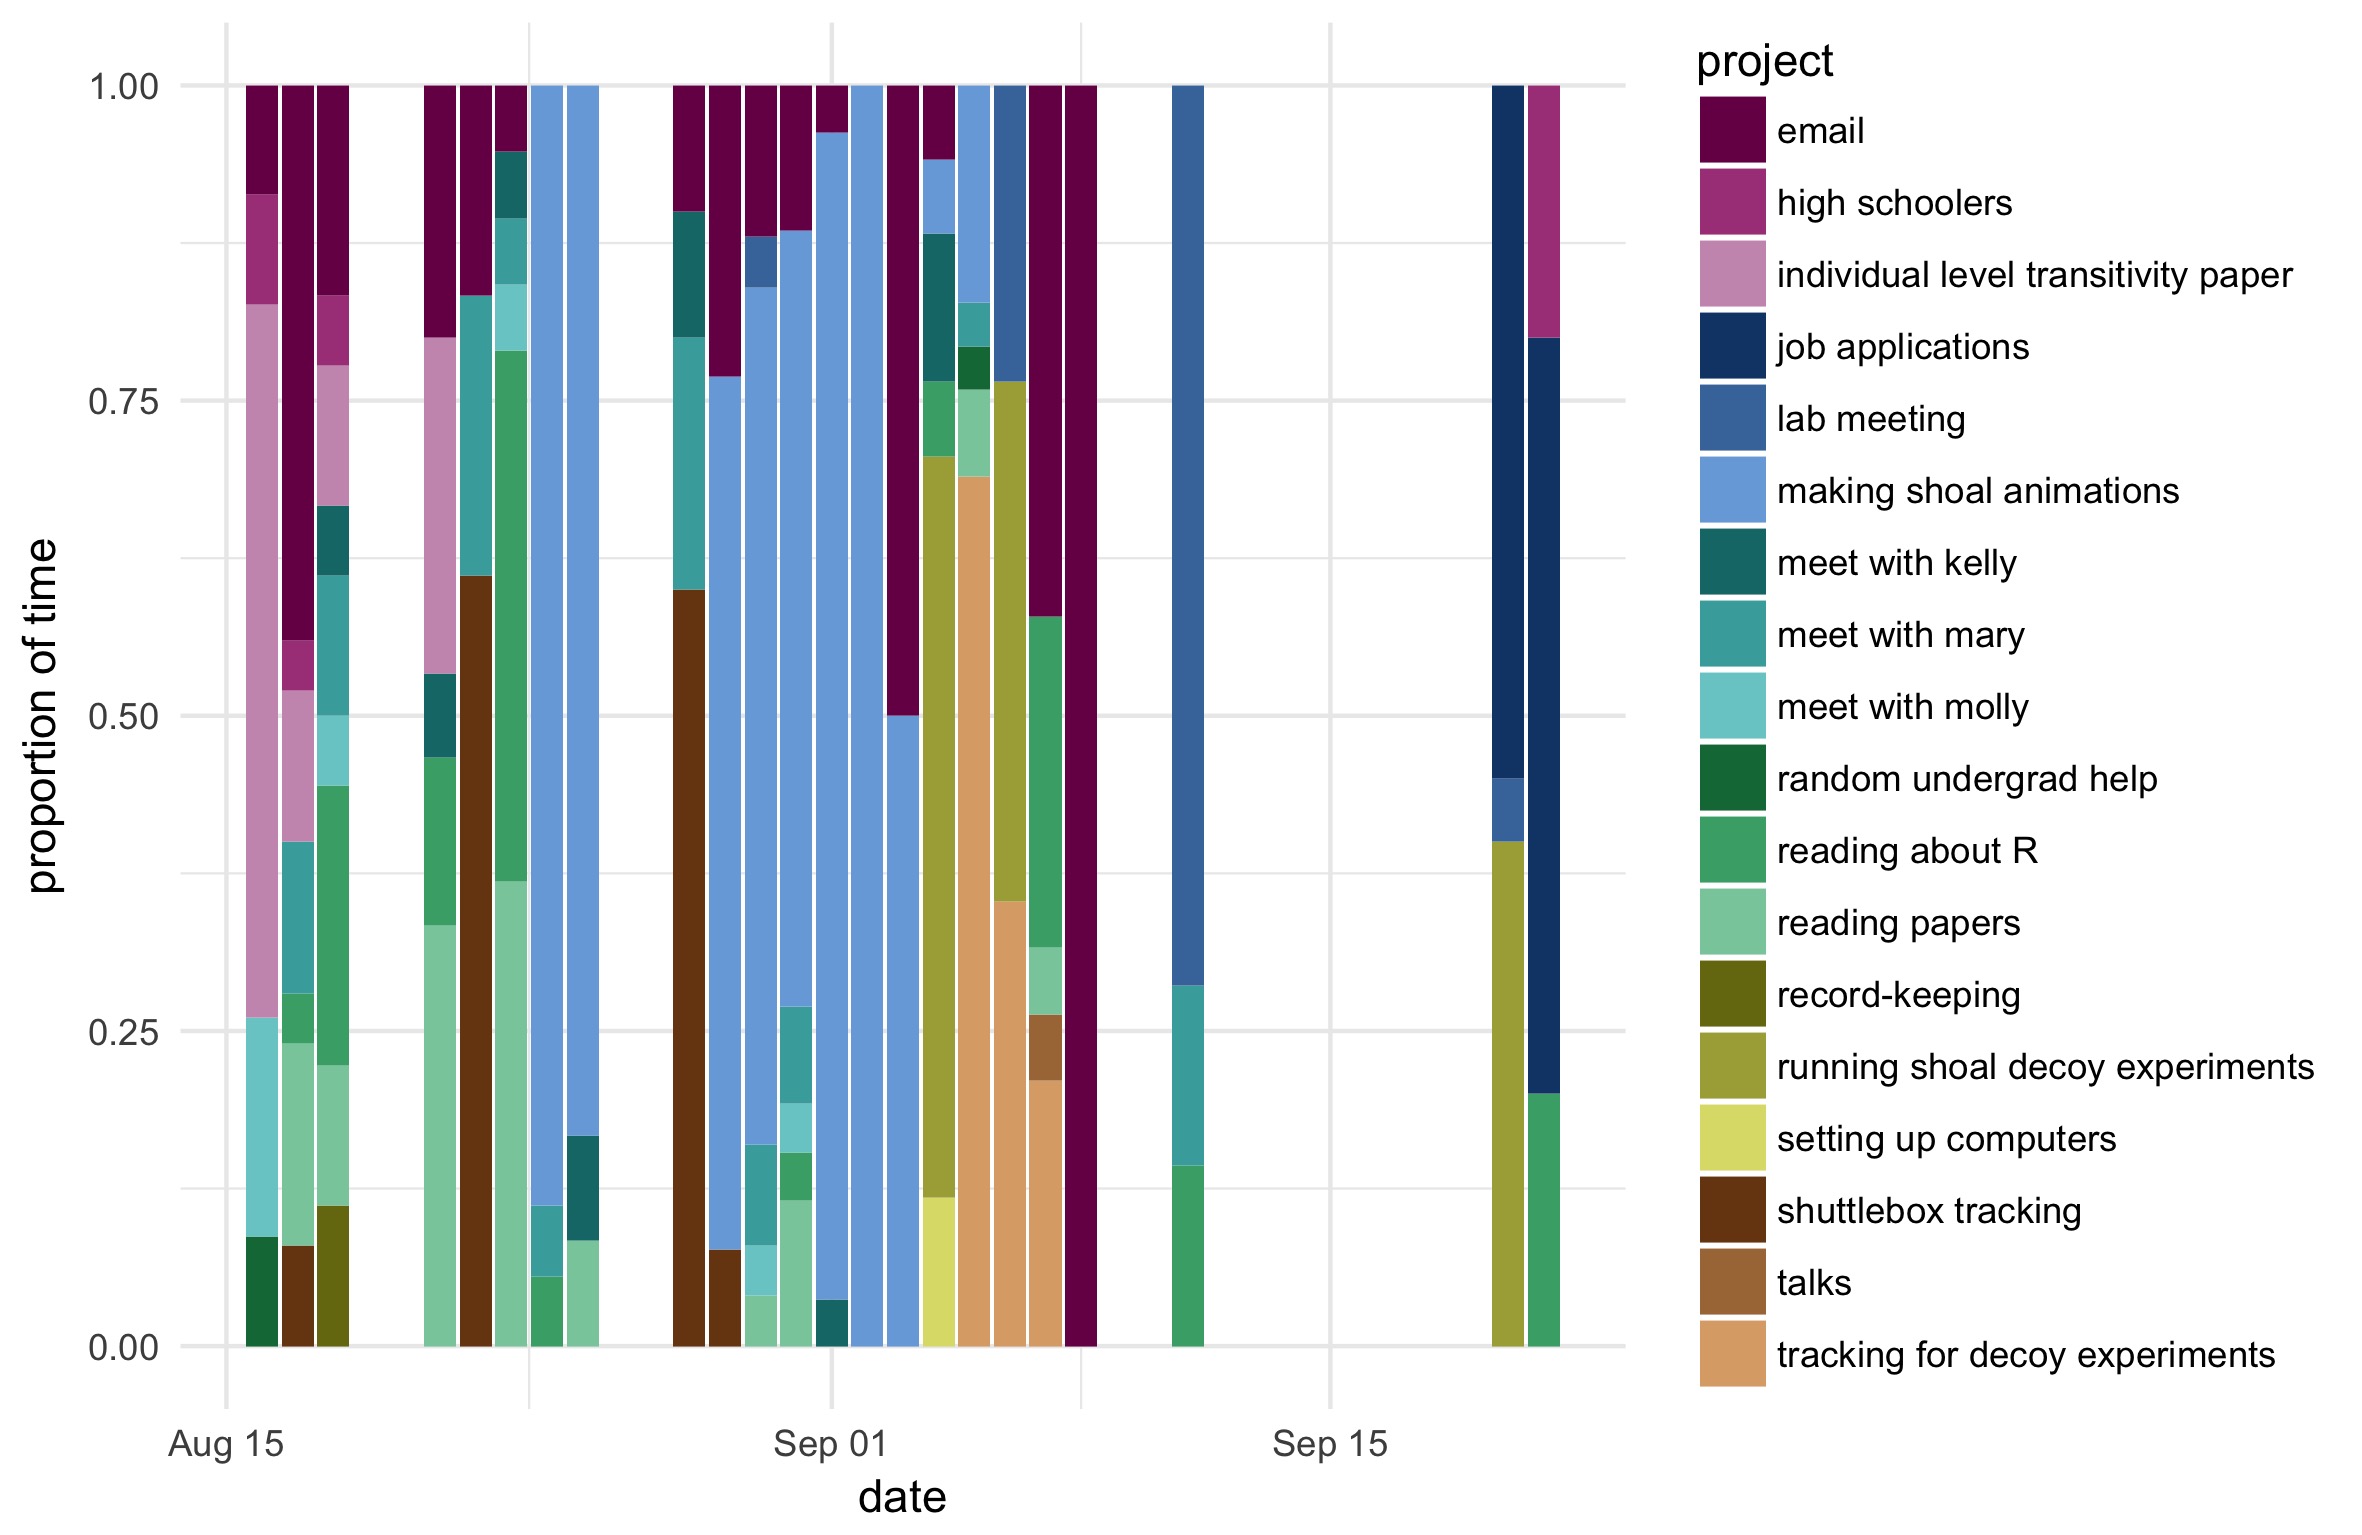
This plot is far from perfect, but it becomes easier to see what you’re spending your time on and how it changes through the week. You could use similar approaches to show the total number of hours you’ve working each day / week, plot a heat map of what days you tend to work on certain projects, etc. Ultimately, I’ve found that this little CLI helps me stay productive and provides a cool little (very personal) dataset for me to play with.